Join the 400M $SUPRA token airdrop

What is the Crypto Fear and Greed Index?
May 26, 2022 - 9 min read
Investors Can Utilize The Crypto Fear and Greed Index To Determine When to Buy
The Crypto Fear and Greed Index is a major cryptocurrency sentiment index created by the investment analysis website Alternative.me. The index is intended to measure how the general market feels about crypto assets. The index began measuring investor sentiment on February 1, 2018.

The Crypto Fear and Greed Index is measured from 0-100, with lower scores representing fear and higher scores representing greed. A 0-24 score represents “extreme fear,” meaning that investors are selling en-masse and exiting the market. A 25-49 score represents “fear,” which means that a fair amount of investors are selling and market interest remains muted. A 50-74 score represents “greed,” which means that significant buying is occurring, leading to rising prices. A 75-100 score represents “extreme greed,” indicating an extremely hot market and the potential for a market “bubble” that could soon burst.
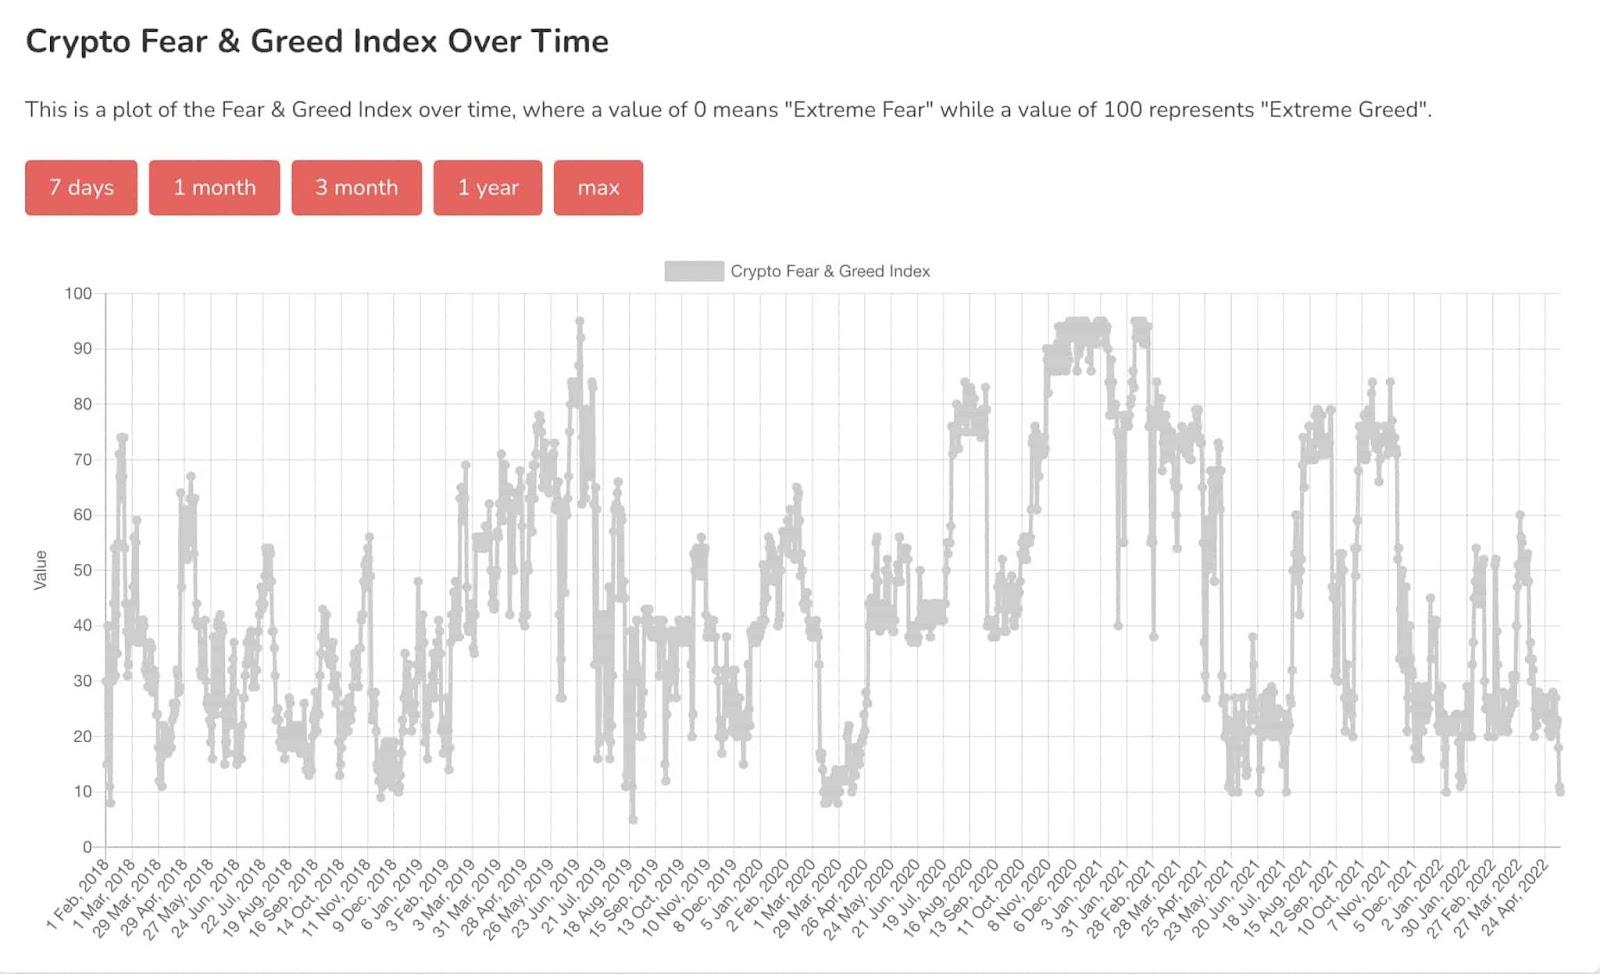
As of early May 2022, the index had reached a resistance level of “10,” meaning “extreme fear”. As previously mentioned, “Extreme fear” generally means that prices are falling drastically and investors are exiting the crypto market, while “extreme greed” is typically associated with prices soaring and new investors entering the market.
Previous “extreme fear” moments recently occurred in January 2022, May, June, and July 2021, March 2020, and August 2019, when the index reached its all-time low of 5. Recent “extreme greed” moments occurred in October and November 2021, November, December, January 2020, August 2020, and June 2019.
For long and short-term crypto investors alike, the Crypto Fear and Greed Index can be a valuable tool. During fear periods, investors may want to build up their position in crypto assets at lower costs, while others are afraid to enter the market. Likewise, in greed periods, investors may want to hold off on purchasing new crypto assets, or even sell off some of their cryptocurrency while prices are still high. However, it should be noted that the index is strongly focused on Bitcoin and less focused on other crypto assets, which may make it less accurate and useful than it could be.
How is the Crypto Fear and Greed Index Calculated?
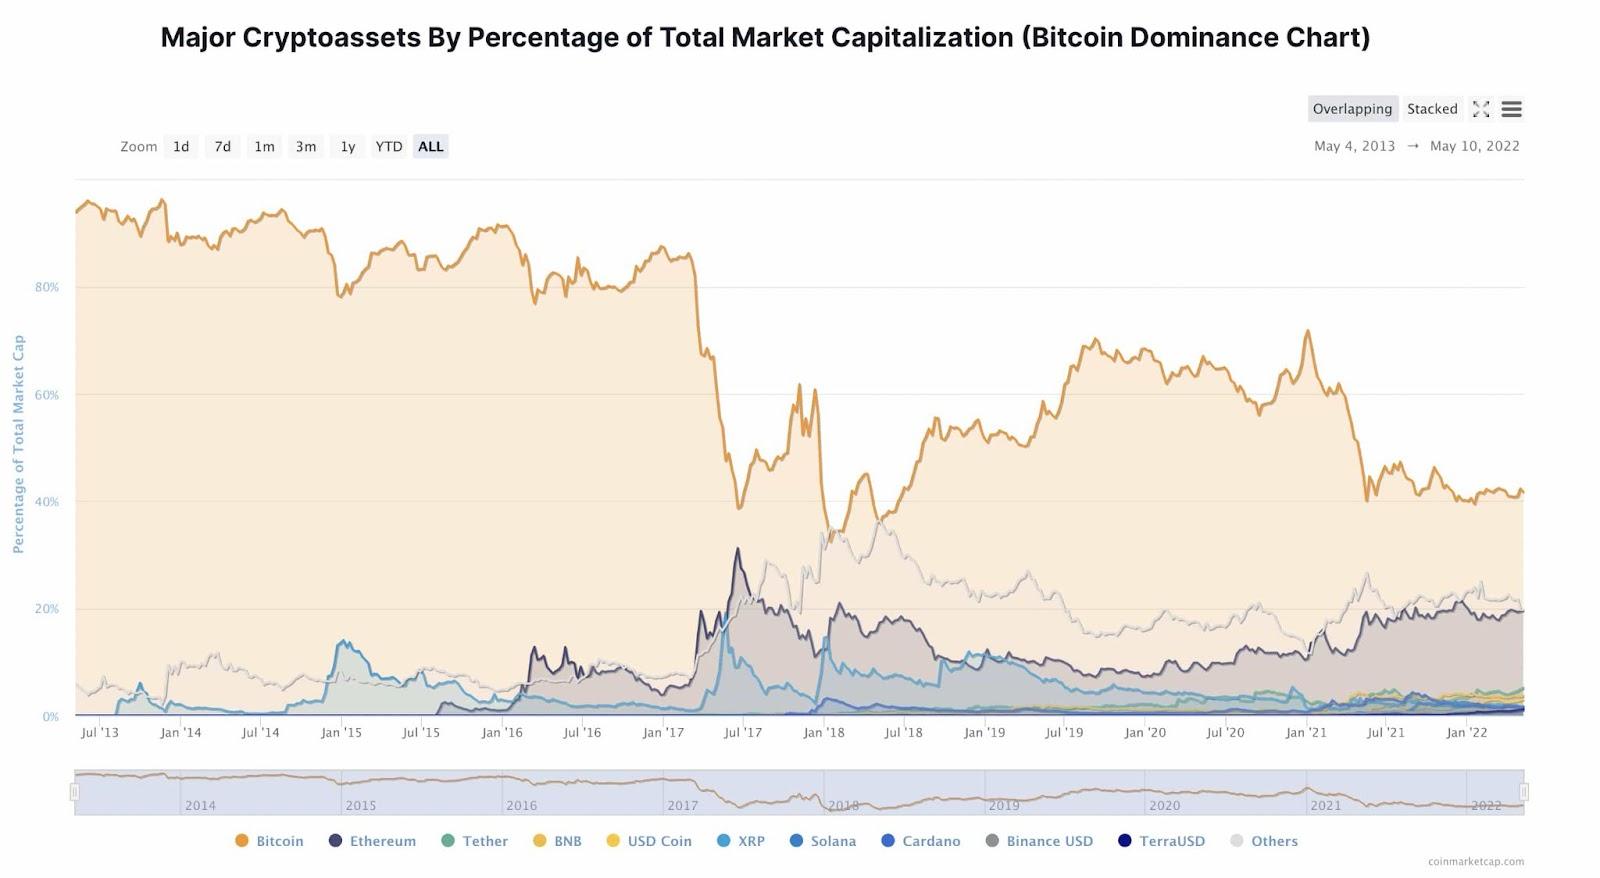
A Bitcoin Dominance Chart, representing one of the several weighted factors used to calculate the Crypto Fear and Greed Index.
Alternative.me’s Crypto Fear and Greed Index is calculated using six major factors, each weighted by perceived importance. These factors include:
- Market Momentum and Volume (25%): Current trading volume and market momentum are some of the most important factors taken into account by the Crypto Fear and Greed Index. The index’s calculation compares current daily volume and momentum with 30 and 90-day averages. Larger selling volumes and daily negative market movements indicate significant sell pressure and hence, increased fear. In contrast, large buying volumes and repeated positive market movements indicate increased greed.
- Volatility (25%): Volatility is another important factor. The higher the volatility of crypto assets, the more fearful investors are likely to be, resulting in a lower index score. Like market momentum and volume, volatility and declines in value (maximum drawdowns) are compared to 30 and 90-day averages.
- Trends (10%): The Crypto Fear and Greed Index also measures the volume of cryptocurrency searches on Google, with higher search volumes generally leading to greater potential greed, and hence, a higher index score. Like other index factors, this search volume research mainly focuses on Bitcoin, and weights search terms by both perceived importance and by volume. However, not all searches are weighted equally (and not all positively impact the index score), with negative searches like “bitcoin market manipulation” and “bitcoin crash” indicating greater fear in the market.
- Dominance (10%): Dominance looks at the percentage of Bitcoin’s market cap compared to the market cap of all crypto. It is typically thought that the increased dominance (increased market share) of Bitcoin represents a more fearful market, as investors may see Bitcoin as a crypto “safe haven.” In contrast, the index treats increased investment of altcoins as representing a more greedy market, with more speculators willing to invest in little-known or little-understood assets in hopes of a big payday. However, this may not be a particularly salient factor in the current market, since Bitcoin’s current market share in early May 2022 (41.66% at a price of around $31,500) is currently less than Bitcoin’s market share of around 43% at its height of $69,000+ in November 2021. This would indicate that investors are actually not flocking to Bitcoin as a “safe haven” in times of market fear. This can likely be attributed to the growth of ETH as well as stablecoins like Tether (USDT) as well as the strength of other altcoins like Binance Coin (BNB). Therefore, a potentially better dominance measurement would likely take the dominance of the top 3-4 assets (or even the top 10 assets) into consideration, instead of only calculating Bitcoin, and compare the market cap of those combined assets to the rest of the market.
- Surveys (15%): While this part of the calculation has been paused, until recently, Alternative.me utilized its sister site, strawpoll.com to conduct weekly crypto polls, which would be used as part of the index calculations. While the polls are still being conducted, they are not currently utilized as a part of the index calculations.
- Social Media (15%): The Crypto Fear and Greed Index utilizes a text processing algorithm to parse through Bitcoin and crypto-related market keywords on Twitter. The algorithm gathers and counts posts with cryptocurrency-related hashtags, and measures how quickly crypto-related posts are being made and how much interaction the posts get over a specific time period. Higher interaction rates typically respond to more market greed, while lower interaction rates may indicate more fearful market behavior. Like other index measurements on this list, the focus and weighting of social media behavior is more focused on Bitcoin than other cryptocurrencies. The creators of the index are currently experimenting with adding a Reddit sentiment analysis using a similar text processing algorithm, which could be added to the index’s social media calculations in the coming weeks or months.
What the Crypto Fear and Greed Index Doesn’t Do
Despite the usefulness of the fear and greed index, it doesn’t tell investors anything about market timing or claim to make any effective predictions about the future. Therefore, even if the market is in extreme greed, prices may still go up further and stay there. Similarly, even if the market is in extreme fear, prices may fall further and remain depressed for an unknown period of time.
In addition, the Crypto Fear and Greed Index does not focus much on ETH, the second-largest asset in crypto. The ETH/BTC ratio can be another important indicator of market movements, which may be of interest to investors. It could be argued that the ETH/BTC ratio is simply another measure of Bitcoin market dominance, but due to the large size of the ETH market cap, it could be useful to include this in their calculations. The index also does not focus on any particularly high-growth sectors in the crypto market, such as stablecoins and their associated governance tokens, or the relative market caps or profit accrued by various DeFi protocols.
It should also be noted that the index also does not factor in Bitcoin halving, which has typically been a bullish factor due to less additional supply (meaning a reduced Bitcoin inflation rate). However, Bitcoin halving may become more of a bearish event as more traders anticipate a temporary rise (and a later fall) meaning this information has already been baked into the market and therefore has less impact.
Overall, the Crypto Fear and Greed Index is only one tool that investors should consider using, along with a variety of fundamental analysis (F/A) metrics when deciding when to purchase crypto. Historically, one way to purchase crypto that some long-term investors prefer is to dollar cost average (DCA), purchasing equal or near-equal amounts of crypto at pre-defined intervals (such as once a month) for extended periods of time, whether the market is greedy or fearful. That way, an investor buys at both the low and high prices and generally pays a middling price (not too cheap, not too expensive) for their crypto.
For day traders and swing traders, the Fear and Greed Index is also of some use, though it should only be used along with a variety of other technical analyses (T/A) tools and metrics. For instance, when the market is fearful and daily declines are common, it may be more useful for a day trader to take small short positions, while when the market is greedy, it may be more useful for them to go long on their daily positions.
Regardless of strategy, investing in crypto is always risky, and investors and traders alike should always be prepared to lose whatever they put in.
The Crypto Fear and Greed Index iOS App and API
In addition to the online index, Alternative.me provides a few other tools for investors. Users with iPhones or iPads can download a Fear and Greed Index widget, which will show the current index data on their phone or tablet’s home screen. To use the widget users will need to first install the free Scriptable app from scriptable.app. Users can utilize the widget API for commercial purposes as long as they give proper credit to Alternative.me.
Other Interesting Bitcoin and Crypto Charts and Indexes
In addition to the Crypto Fear and Greed Index and traditional price charts, there are a variety of other indexes that crypto investors and traders may be interested in checking out. A few of the most interesting include:
- The DeFi Pulse Index: Created by DeFi information aggregator DeFi Pulse, the DeFi Pulse Index is a capitalization-weighted index that tracks the performance of DeFi assets across the market.
- Bitcoin Profitable Days Chart: This chart looks at the days that holding Bitcoin was profitable vs. the days that it was not.
- Bitcoin Stock to Flow Model: This chart measures the amount of Bitcoin in circulation compared to the amount of Bitcoin mined (on an annual basis), and compares this ratio with Bitcoin’s price.
- CoinDesk Large Cap Index: The CoinDesk Large Cap Index (DLCX) tracks a basket of large-cap cryptos via a capitalization-weighted index, covering a minimum of 70% of the digital asset market cap.
- CoinDesk Smart Contract Platform Select Ex ETH Index: The CoinDesk Smart Contract Platform Select Ex ETH Index (SCPXX) tracks the market capitalization-weighted performance of the largest and most liquid Eterheum compatible Smart Contract platforms (mainly Layer-2s).
In addition to the indexes and charts above, provided by Lookintobitcoin.com, CoinMarketCap, and CoinDesk, The Block also provides a variety of even more granular charts. These charts compare the performance of Bitcoin to a variety of other assets, including DeFi assets, compare Bitcoin and ETH market caps to various traditional company market caps, and compare the relative performance of non-Bitcoin L1s. The Block also provides a variety of other useful crypto and DeFi charts, including TVL (total value locked) charts for blockchains, transaction volume charts for EVM compatible and non-EVM compatible Layer-1s, and even charts measuring the volume of funds stolen in DeFi exploits.
In Conclusion: The Crypto Fear and Greed Index is a Powerful Indicator, Yet Has Significant Limitations
The Crypto Greed and Fear Index is an excellent benchmark for crypto traders, investors, and market analysts. However, it has its limitations, such as its laser focus on Bitcoin to the detriment of other crypto assets, including ETH and stablecoins.
The index is also not fully transparent in the ways that it tracks and calculates its data, particularly in regard to its social media and trends analysis. It also does not provide the exact formulas it uses to calculate market momentum and volume or volatility. All of this information would be highly beneficial to those attempting to use the index for practical purposes.
Therefore, as previously mentioned, while helpful, the index should be only one of many data points used to track the cryptocurrency market, and should not be relied on heavily to make investment or trading decisions.
Note that this article is for informational purposes only, and should not be considered financial advice.
References:
- Crypto Fear & Greed Index. Alternative.
- Major Cryptoassets By Percentage of Total Market Capitalization (Bitcoin Dominance Chart). CoinMarketCap.
- DeFi Pulse Index. CoinMarketCap.
- Bitcoin Profitable Days. Look Into Bitcoin.
- Stock-to-Flow Model. Look Into Bitcoin.
- CoinDesk’s Large Cap Index: Large Cap Index (DLCX). CoinDesk.
- SCPXX: CoinDesk Smart Contract Platform Select Ex ETH Index. CoinDesk.
- BTC, ETH Prices and DeFi Index. The Block.
Related Articles
- Kraken vs. Binance: Crypto Exchanges Compared
- How to Mine Bitcoin Cash: The Complete Guide (2022)
- How to Buy Cryptocurrency: Coinbase for Beginners
Learn More
RECENT POSTS
Get news, insights, and more
Sign up for the Supra newsletter for company news, industry insights, and more. You’ll also be the first to know when we come out of stealth mode.
©2024 Supra | Entropy Foundation (Switzerland: CHE.383.364.961). All Rights Reserved