Join the 400M $SUPRA token airdrop

VPVR Indicator in Crypto Trading, Explained
June 24, 2022 - 10 min read
How Crypto Traders Can Use Volume Profile Visible Range (VPVR) to Trade More Effectively
Volume profile visible range (VPVR) is an indicator used in technical analysis for trading both crypto and other assets. VPVR is typically used for volume trading, which is generally most effective when trading larger-cap crypto assets.
VPVR and other volume profile indicators (VPIs) are generally plotted with the horizontal axis representing total volume traded and the vertical axis representing time. VPVR is somewhat similar to On Balance Volume (OBV), but OBV is averaged out over time, whereas VPVR provides numbers for specific intervals.
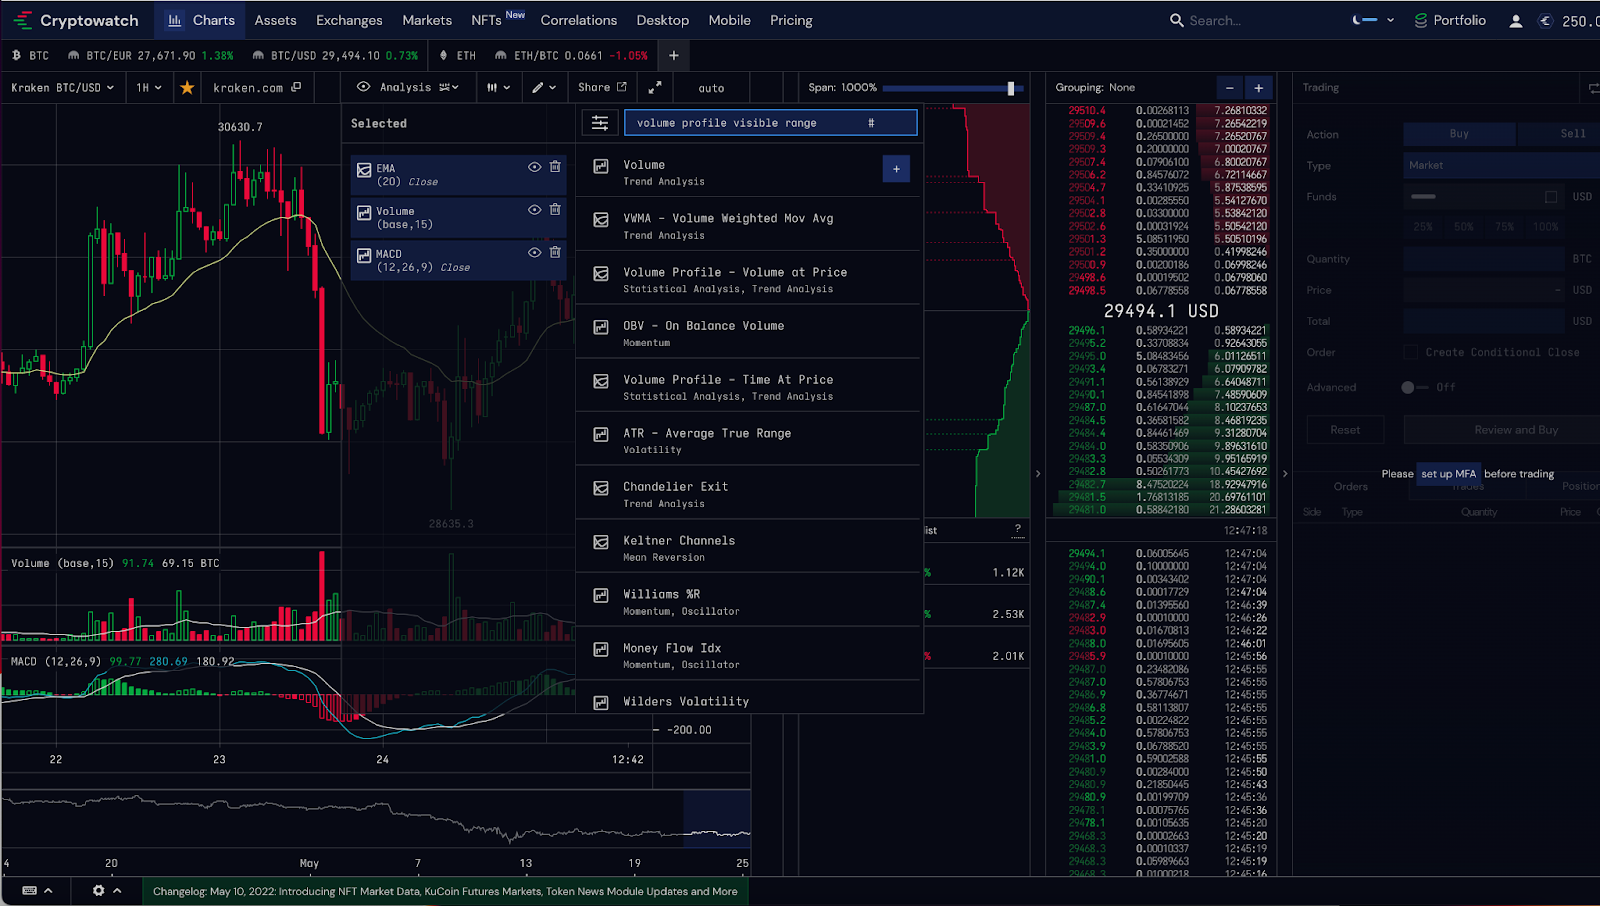
Example of VPVR for Bitcoin Futures on TradingView.
What is Volume Trading?

Volume trading is a trading strategy that uses volume-based indicators as the major factors a trader will use to determine a trading strategy, including determining their entrance, exit, stop-loss, and take-profit. The entrance is defined as the level at which a trader buys an asset, the exit is the price at which a trader sells an asset, and the stop-loss is the level that an asset must fall before a trader will sell to limit their losses, while the take-profit is the level at which a trader plans to sell an asset if it rises according to their prediction.
Other Volume Trading Indicators
In addition to VPVR, there are two other major volume indicators for trading. These can be used in lieu or in combination with VPVR to develop a trading strategy. These include:
- Volume Profile Fixed Range: Volume Profile Fixed Range (VPFR) can be easier to find for free on many exchanges, and may actually be easier to use for less-experienced traders. Volume Profile Fixed Range is very similar to VRVR, however, it allows users to define the start and endpoint, making it easier to view the volume for a selected range.
- Session Volume: Volume Profile Session Volume (VPSV) shows the volume profile for a series of trading sessions. Each session is considered a day, which makes this better for looking for longer-term volume trends.
Volume Trading Terminology
When utilizing VPVR and other volume trading indicators like VPFR or session volume, it’s also important to understand a little bit more about the specific terminology of volume trading.
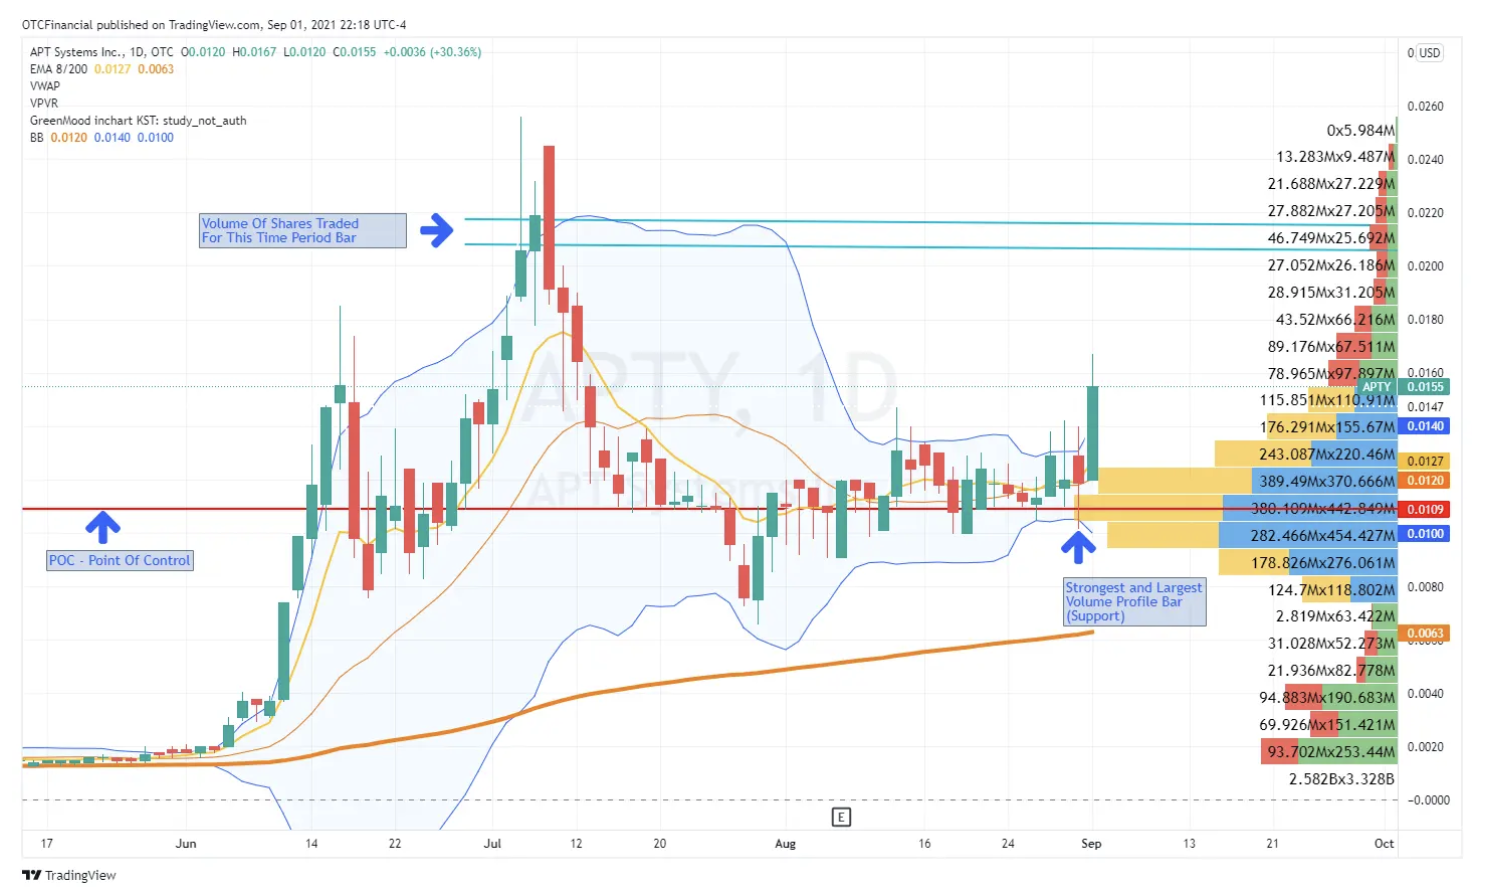
- Point of Control (POC): Point of Control (POC) is the node with the highest volume profile, and appears as the longest bar. This can be used as an important retest point or to calculate potential support and resistance.
- Developing Point of Control (Developing POC): Developing Point of Control (Developing POC) is an indicator that represents the change of the POC over time. This can be represented by a line that tracks the highest volume profile trading sessions
- Value Area (VA): A Value Area (VA) is an indicator that represents the price levels at which 70% of the total volume of an asset was traded during a specific period. It can be used as an alternative to moving averages to calculate potential support and resistance.
- Value Area High (VAH): Value Area High (VAH) is the highest point in a specific value area.
- Value Area Low (VAL): Value Area Low (VAL) is the lowest point in a specific value area.
- Low Volume Node (LVN): A Low Volume Node (LVN) is a node with a transaction volume substantially lower than average.
- High Volume Node (HVN): A High Volume Node (HVN) is a node with a transaction volume substantially higher than average. It is the opposite of a Low Volume Node (LVN). HVNs show the prices at which the highest volume of an asset was traded.
- Clearance: A Clearance represents an area where only Low Volume Nodes (LVNs) are located, indicating a sustained period of lower trading volume. Due to the low volume traded, prices could be particularly volatile until a High Volume Node (HVN) appears.
Popular Volume Trading Strategies and Secondary Indicators
When using VPVR to trade, it’s essential to use it as just one of several indicators. VPVR can also be misleading, especially if you only look at it for a short-range interval. Make sure to look at VPVR for short, mid-term, and long-term periods in order to understand the VPVR range and variability for a specific asset. For day trading, day volume profiles may be the easiest to understand, particularly for those who trade in four-hour increments.
Common volume trading strategies and indicators include:
- Volume vs. Price Change: If the volume is low, but the price of an asset moves quickly, the new price may be unsustainable, leading to a spike, followed by a choppy top level, and then a quick reversal to the previous price. This is sometimes humorously referred to as a “Bart Simpson” pattern as it looks rather similar to the famous cartoon character’s head. If an asset price has reached the choppy top level, this could be an opportunity to briefly short the asset.
- Filling The Gap: As with a price volume vs. price change based strategy, if an asset goes up quickly with little volume, the price may fall back suddenly to the previous price, without a choppy “Bart Simpson” period, therefore, “filling the gap” between the previous price and the new (temporary) high.
- Volume Support and Resistance: If an asset has reached a new price level with a very high volume, this could become a new support or resistance level, which traders can use to calculate when to go either short or long on a crypto asset.
Other important general trading strategies and indicators include:
- Moving Averages: Most traders, when trading volume, momentum, or other strategies, utilize moving averages as important indicators for their strategy. Common moving averages include Simple Moving Average (SMA), which averages the closing prices of an asset for a specific period, such as 20-days. An exponential moving average (EMA), in contrast, utilizes the same core data but puts more weight on recent prices. Volume-Weighted Average Price (VWAP) is a moving average that takes into account both price and volume, and resets every trading period (or, for crypto, typically every day), making it potentially better for day trading. Moving averages can be utilized to calculate potential support and resistance levels to see if an asset is “overbought” or “oversold” and where the price may go in the future.
- Order Flow and Heatmaps: Order Flow trading involves observing the flow of trading orders and their impact on the asset price in order to predict future prices. For example, big orders may lead to more sudden price changes in comparison to many smaller orders at the same overall volume. It is an extremely granular form of analysis that is generally intended for trading over very short intervals. In comparison, heatmaps are a visual way of displaying order flow, market liquidity, and trading behavior by showing the best “ask price” and the best “bid price” visually. Heat maps are not considered an indicator, just a visual way of demonstrating order flow.
- Bollinger Bands: Bollinger Bands is a technical indicator that utilizes three lines to calculate potential support and resistance levels using three lines. A typical calculation utilizes a 20-day simple moving average (SMA) for the middle band. The lower band is created by taking the SMA of the middle band and subtracting 2x the daily standard deviation. The upper band is determined by adding twice the daily standard deviation of the SMA utilized by the middle band. Other SMA lengths can be used for longer-term or short-term Bollinger Bands calculations.
- Ichimoku Cloud: The Ichimoku Cloud is a combination of technical indicators intended to project support and resistance levels, as well as trend direction and momentum. When the price is above the cloud, the overall trend is up, while when the price is below the cloud, the overall trend is down. Unlike traditional support and resistance indicators, the Ichimoku cloud is intended to project support and resistance levels into the near future.
- The Wyckoff Method: The Wyckoff Method is a market cycle theory that posits that asset prices are influenced by periods of accumulation (increased buying) and distribution (increased selling). The Wyckoff Method market cycle is composed of four phases, accumulation, markup, distribution, and markdown.
- Relative Strength Index: Relative Strength Index (RSI) is a momentum indicator that calculates the amount of recent price ranges from 1-to 100. Assets that are 90 or above are considered “overbought” and may be due for a correction, while assets that are 10 or under are considered “oversold” and may be due for a spike in price. The Relative Strength Index itself is relative. For example, some assets may trade at a slower speed or volume, and for these assets, “overbought” could be 70 or above, and “over-sold” could be 30 or below.
Now that we’ve discussed some of the most common volume trading strategies and indicators that can be combined with VPVR and other volume indicators to create an integrated trading strategy for crypto trading, it’s important to mention where you can actually utilize it.
Currently, the VPVR indicator for cryptocurrencies is available on platforms including:
- Cryptowatch (Free)
- Tensorcharts (Pro)
- TradingView (Pro)
For those that may not know, Cryptowatch is a popular crypto analysis and charting software API that can be connected to exchanges like FTX for direct trading. Cryptowatch is perhaps the best way to trade on VPVR as it allows integration with Coinbase, FTX, Binance, Kraken, and Bitfinex. Cryptowatch is owned by Kraken.
In general, trading platforms do not directly implement secondary VPI indicators like VPVR due to the high data requirements, which could slow down the exchange for all users, which is why using something like Cryptowatch is so handy.
You can also use TradingView to get VPVR info.
Trading VPVR on TradingView
While TradingView is best known for stock data, you can also use it to provide data on cryptos including BTC, ETH, and BNB, among many others. You can get VPVR info on TradingView, but you will need a paid account. All you need to do is go to the “Indicators” button and search the term “Visible Range Volume Profile.” If you want to test a similar indicator without getting a pro account, you can search “Poor Man’s Volume Profile.”

Trading VPVR With Cryptowatch
To select VPVR on Cryptowatch, open the charts section, go to “Analysis” and type in Visible Profile Volume Range. In Cryptowatch, this indicator is labeled “Volume Profile – Time at Price.”
Setting Up VPVR on Binance, Kraken, and FTX with Cryptowatch
You will need to take an extra few steps to set up your VPVR trading on Binance via Cryptowatch. In general, this process is similar to the process you will need to use on Kraken, FTX, or Bitfinex.
You will need to click the “Profile” icon, go to “Exchange Keys,” and plug in the Cryptowatch API key. If you do not already have an API key, you will need to take several steps to generate one.
Use this guide to set up Cryptowatch on Binance.
Use this guide to set up Cryptowatch on FTX.
Use this guide to set up Cryptowatch on Kraken.
In Conclusion: The VPVR Indicator is Useful, but Only in Context
When trading crypto or other assets, VPVR can be a useful tool in any trader’s toolbelt. However, as previously mentioned, VPVR is only one indicator, so it must be used along with other indicators to create a sensible strategy. It’s also not the only volume indicator that can be used, so it may not be the best for everyone. Nearly every successful trader creates their own strategies, and those typically consist of different combinations of indicators. However, many experts believe that it’s important to avoid using too many indicators, as this can get confusing and lead to a muddled and overly complex strategy.
It should be noted that day trading is extremely risky, especially in the volatile crypto market. An average of at least 95% of intra-day and active traders lose money and could potentially be better served through a buy-and-hold strategy. If you are new to trading, you should consider opening a paper trading account to test your strategies until you are continuously profitable. New traders can expect to lose money on many, if not most of their trades, and even breaking even is often considered an impressive achievement for a beginning trader.
Traders should also be sure to plan every potential trade in detail, identifying what chart pattern or strategy they are using, and setting a careful pre-set stop-loss (the maximum price an asset will fall before it is automatically sold) as well as a take profit (the price a trader will sell an asset at if it goes up in order to lock in your gains). In general, a trade should at least have a risk to reward ratio of 1:3 or higher. For instance, if you enter a trade with a stop loss that, if executed, would lose you 1% of your trading portfolio, your expected take profit level, if reached, should provide at least a 3% gain. This way, you can still end up losing on many of your trades, but remain profitable.
In addition, it should be noted that many experts believe that no trade should risk more than 0.5% to 2% of your entire trading portfolio, which should only be a small subset of your entire investments and savings. Day trading can be a fun hobby for some, but in general, only those that treat it like a business can expect to earn any profit.
The above is for informational purposes only, and should not be considered financial advice of any kind. Never invest more money than you are willing to lose.
References:
- VPVR / AltcoinTrading.NET glossary. Altcointrading.net
- Ghalebi, M. (2021, Jul.) Volume Profile – 5 Best VPVR Trading Strategies. Trading in Depth.
- VPVR Trading and Volume Profile Strategies. Altcointrading.net
- Heatmap in Trading: How to Learn What Market Depth is Hiding?. Bookmap.
- Mitchell, C. (2022, Mar.) Using Bollinger Bands to Gauge Trends. Investopedia.
- Mitchell, C. (2022, Apr.) Ichimoku Cloud Definition and Uses. Investopedia.
- Farley, A. (2022, May) The Wyckoff Method: Making Money the Wyckoff Way. Investopedia.
- Applying analysis tools. Cryptowatch.
- How to trade on Binance. Cryptowatch.
- How to trade on FTX, FTX.us. Cryptowatch.
- How to trade on Kraken. Cryptowatch.
Related Articles
- How to Mine Bitcoin Cash: The Complete Guide (2022)
- Crypto Trading Bots: What You Need to Know
- Kraken vs. Binance: Crypto Exchanges Compared
Learn More
RECENT POSTS
Get news, insights, and more
Sign up for the Supra newsletter for company news, industry insights, and more. You’ll also be the first to know when we come out of stealth mode.
©2024 Supra | Entropy Foundation (Switzerland: CHE.383.364.961). All Rights Reserved